โ† Back to Projects
๐Ÿ“Š

Motor Insurance Dashboard

6-page Power BI dashboard โ€” 292K policies ยท Loss Ratio ยท Claims ยท Risk Profiles ยท Trends

๐Ÿ“‹ Project Overview

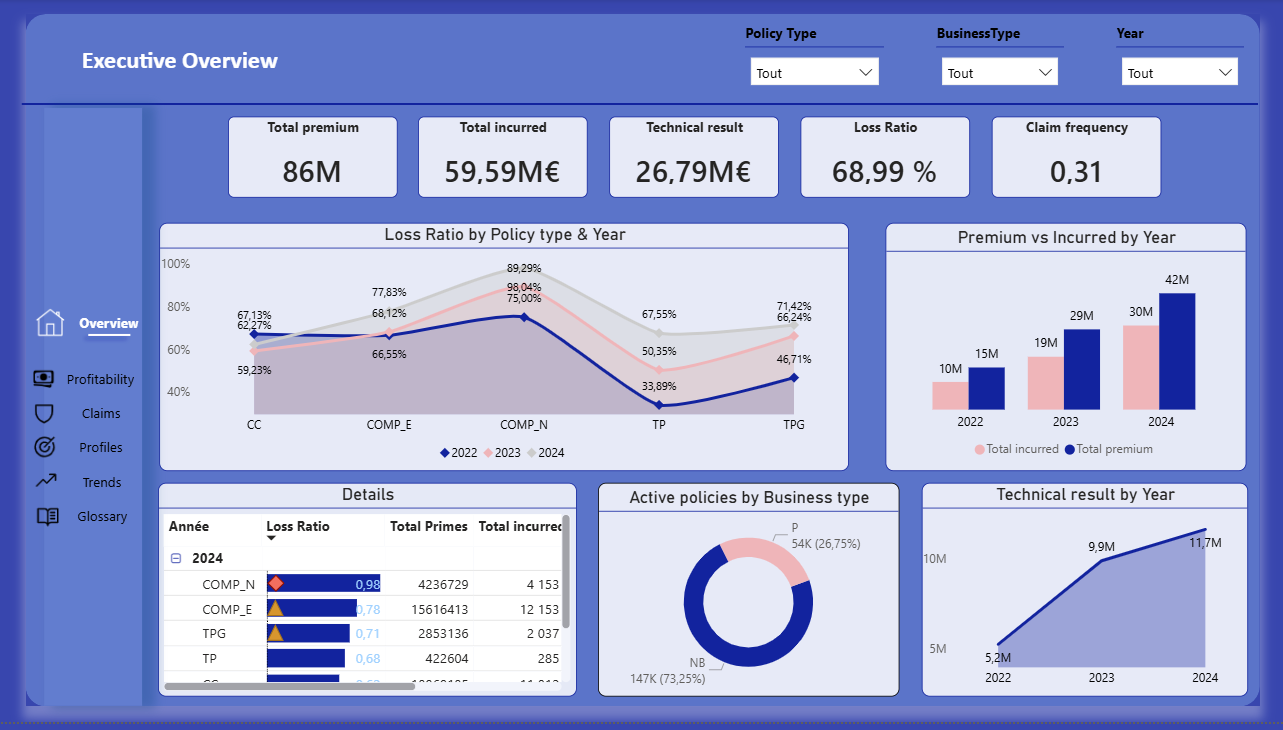
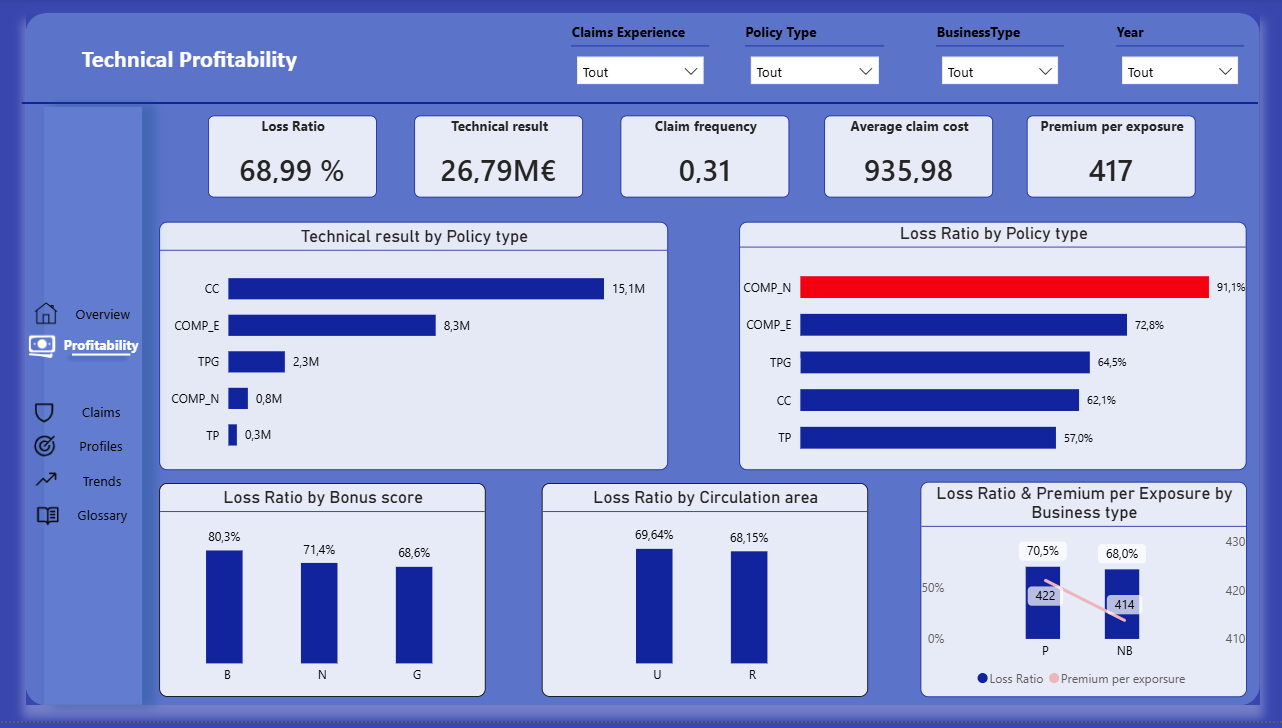
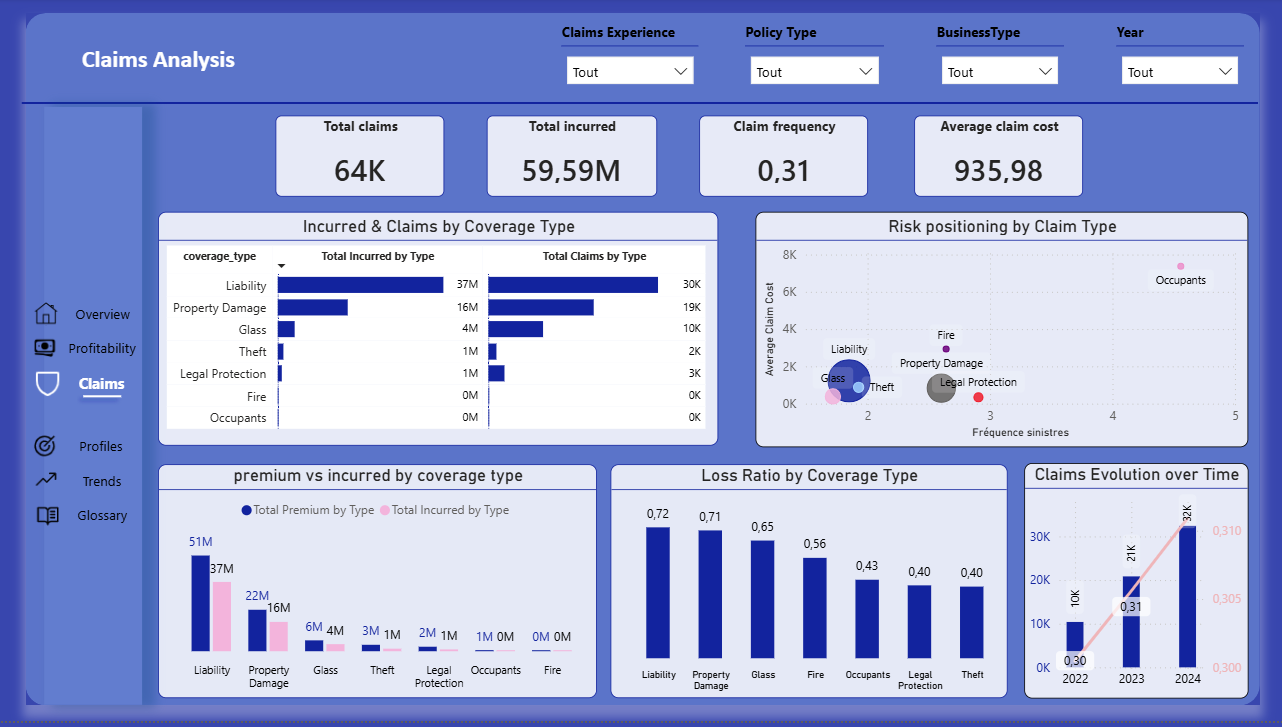
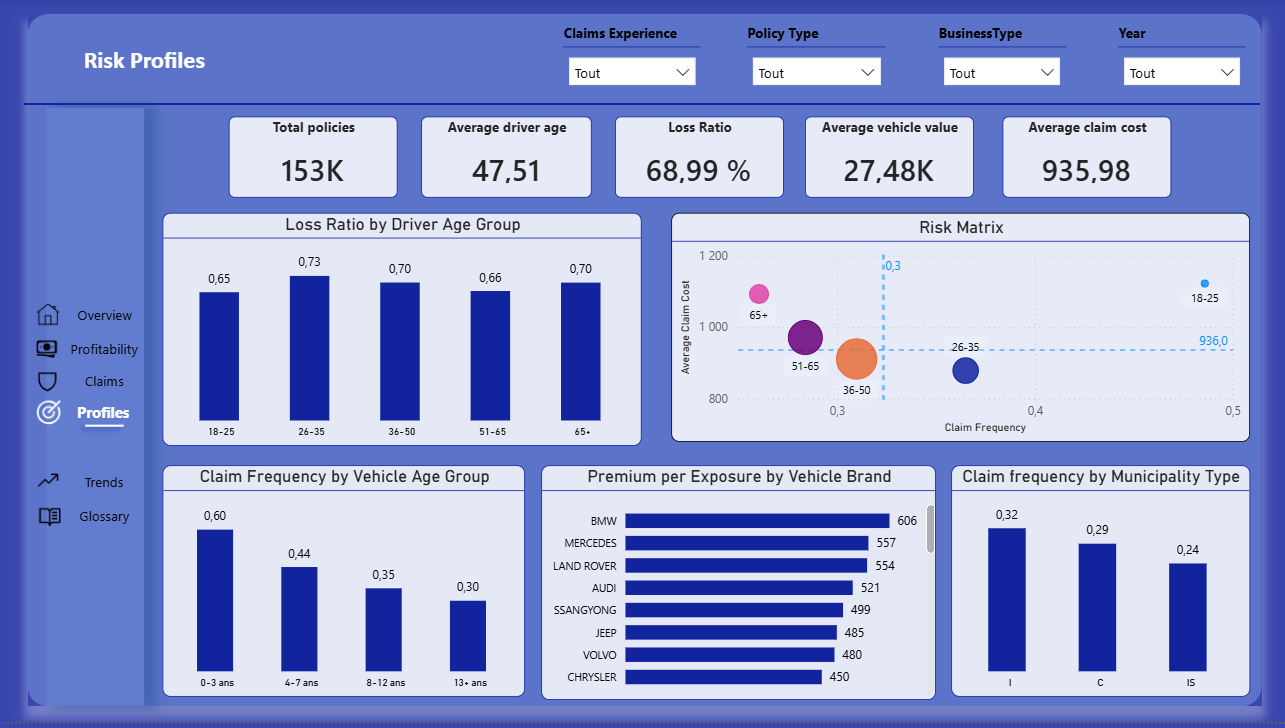
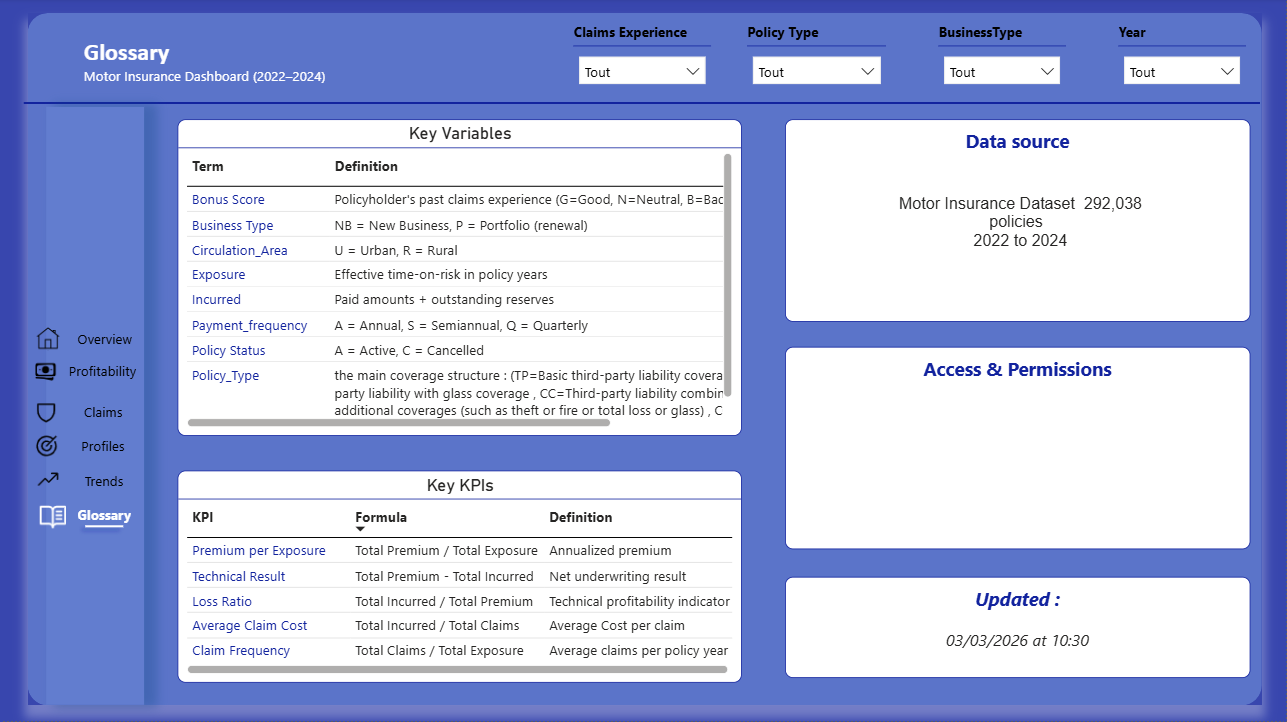
End-to-end business intelligence dashboard built on a motor insurance dataset of 292,038 policies (2022โ€“2024). The dashboard covers executive KPIs, technical profitability, claims analysis, risk profiling by driver and vehicle, and performance trends โ€” designed to support pricing, underwriting and portfolio management decisions.

Policies
292K
Total Premium
86.38Mโ‚ฌ
Loss Ratio
68.99%
Tech. Result
26.79Mโ‚ฌ
Claim Frequency
0.31
Dashboard Pages
6 pages
Power BI DAX Power Query Data Modelling Insurance Analytics

๐Ÿ—‚๏ธ Dashboard Structure

6 pages covering the full insurance analytics lifecycle โ€” from executive overview to granular risk profiling. Click any card to enlarge.
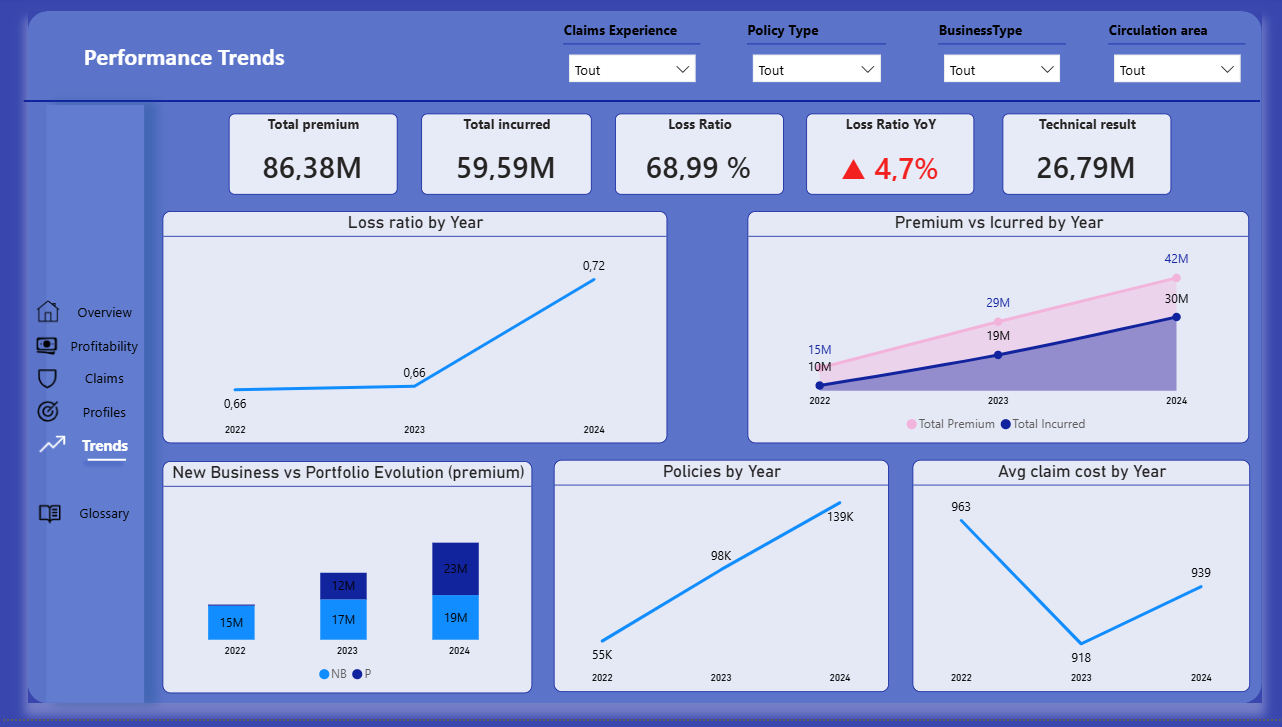
๐Ÿ’ก Key Business Insights

โš ๏ธ COMP_N โ€” Loss Ratio 91.1%
Comprehensive New is the only loss-making policy type. Urgent pricing review recommended.
โœ… Technical Result +125%
Technical result grew from 5.2M (2022) to 11.7M (2024), strong underwriting improvement.
โš ๏ธ Loss Ratio YoY +4.7%
Loss Ratio increased from 66% to 72% in 2024 โ€” claims costs growing faster than premiums.
๐Ÿ“Š Liability = Largest Exposure
Liability accounts for 37Mโ‚ฌ incurred and 30K claims, the dominant coverage type by volume.
โœ… Bonus Score Discriminating
Loss Ratio: B=80.3% vs G=68.6% โ€” claims history is a strong pricing signal.
๐Ÿš— New Vehicles = Higher Risk
Claim frequency drops from 0.60 (0โ€“3 yrs) to 0.30 (13+ yrs), vehicle age is key risk factor.

โš™๏ธ Key DAX Measures

Core measures built to power the dashboard analytics.

Loss Ratio = DIVIDE([Total Incurred], [Total Premium], 0)
Technical Result = [Total Premium] - [Total Incurred]
Claim Frequency = DIVIDE([Total Claims], SUM(motor_insurance[total_exposure]), 0)
Premium per Exposure = DIVIDE([Total Premium], SUM(motor_insurance[total_exposure]), 0)
Loss Ratio YoY = VAR MaxYear = MAX(motor_insurance[Year])
VAR PrevLR = CALCULATE([Loss Ratio], ALL(motor_insurance), motor_insurance[Year] = MaxYear - 1)
RETURN DIVIDE([Loss Ratio] - PrevLR, PrevLR, 0)

๐Ÿ—„๏ธ Data Model

Star schema built around the main motor_insurance fact table with 3 unpivoted dimension tables for granular coverage-level analysis.

Fact Table
motor_insurance
292K rows ยท 40+ columns
Claims Unpivot
claims_unpivot
7 coverage types
Incurred Unpivot
incurred_unpivot
7 coverage types
Premium Unpivot
premium_unpivot
7 coverage types
Dim Coverage
dim_coverage
Bridge table
Cleaning
-62K rows
removed inconsistencies